Life, Blog Stats, and {No} Profit
It’s almost been three years since this website went online, so I figured it would be interesting to dive into the history of this blog, and also take a look at some statistics regarding visitors and money.
Table of Contents
Background
Deciding to Create “Techbit”
I won’t get too much into my background here, but essentially by the time 2018 had rolled around I had been working in IT security for three years and in the IT industry professionally for 10 years total. Besides that, I had been messing around with computers and technology my entire life; starting when I was one year old.
Having such an interest in technology meant that I was always learning and implementing new systems, writing scripts, building hardware, etc. While I greatly appreciate the amount of information that’s available online, there were some problems that I found pretty quickly:
- Usually in trying to solve a problem, I needed to combine information from multiple different resources in order to get something working
- A lot of these resources would tell you what you needed to do (like “create a partition and format it as NTFS”), but not explain how to do it, or even why you were doing it. If I didn’t already know how to do something I’d have to go looking for that information as well
- Future me would have to spend time again trying to find these disparate pieces of information, so it would be best if I just combined them all into a single piece of documentation so that future me would be able to thank past me
- If I’m creating documentation anyway, I might as well write it in a simple, step by step and easy to follow manner and post it online, so that others may benefit from my experience as well.
And thus, Techbit was born.
Putting the Site Online
My goal in creating Techbit was (and still is) to turn it into a helpful resource for people who are not as tech-savvy but want to solve their own similar problems. Eventually I would like to be able to make money from this site, but that is not my main goal (as you’ll see shortly). My intention was to post regularly with at least one article a week, to keep content fresh, keep people coming back, and to grow the site. This is a side project for me, but I did want to devote time into this because I feel that it is important to help others who are coming along behind you.
The site went online on September 15, 2018, and these were the dates of my first articles (this will be important in a minute):
- September 10, 2018 - Creating a Bootable Ubuntu UEFI USB Drive
- September 18, 2018 - Repair GRUB2-efi boot
- September 24, 2018 - Using a Raspberry Pi For Digital Signage
- October 7, 2018 - Creating Digital Collections
- November 12, 2018 - Logging Into Zoneminder Using an Authentication Hash
- November 18, 2018 - Using Crave With Ad-Blockers
- November 24, 2018 - The Perfect Cell Phone (for Me) Doesn’t Exist. Or… Why I Finally Broke Down and Bought an iPhone
- January 19, 2019 - H.264 Encoding Versus H.265 Encoding
You might notice two big gaps there from October to November and November to January. Gaps that would get increasingly larger between times when I would post a new article.
So What Happened?
Life.
Life happened. My mother was diagnosed with stage 4 colon cancer on October 20, 2018. The following months were difficult as I’m sure you can imagine. She passed away on April 13, 2020 at the age of 65.
I had already been going through some mental health challenges for years, so needless to say after her diagnoses I wasn’t thinking much about writing for this blog. Processing my own physical and mental health journey, coming to terms with my Mother’s diagnoses and death, living through a worldwide pandemic (and every light that THAT has shone on how terrible humans can be) which is STILL ongoing 18 months later… yea I was broken inside and out.
But time moves forward and life continues on. We can no longer bring some people with us on our continuous journey around the sun on this little blue ball of a planet, but we can celebrate their life, their legacy, and we can cherish their memory. Most importantly, we can realize that life is short. Life is precious, and it’s the only one we’ve got. So call your mother. I wish I still could. Tell the people in your life that you love them before you no longer have that option.
Statistics
Ok, now that I’ve gone and had an unintentional cry this morning, on to the reason why I decided to write this article in the first place. The statistics.
Important dates and things to keep in mind:
- September 15, 2018 - Site went live
- September 29, 2018 - First decided to keep metrics on visitors
- February 24, 2019 - Creating a Bootable Windows 10 UEFI USB Drive Using Linux was posted
- Bare minimum metrics are collected and sent to my own server. Do Not Track, adblockers, etc. all affect what information (if any) I receive for tracking purposes
- Access logs on the server only go back as far as October 2, 2020 because I moved to a new server then and didn’t keep the access logs from the old server
Number of Visitors
First up, here’s the total number of “tracked” visits and pageviews from September 29, 2018
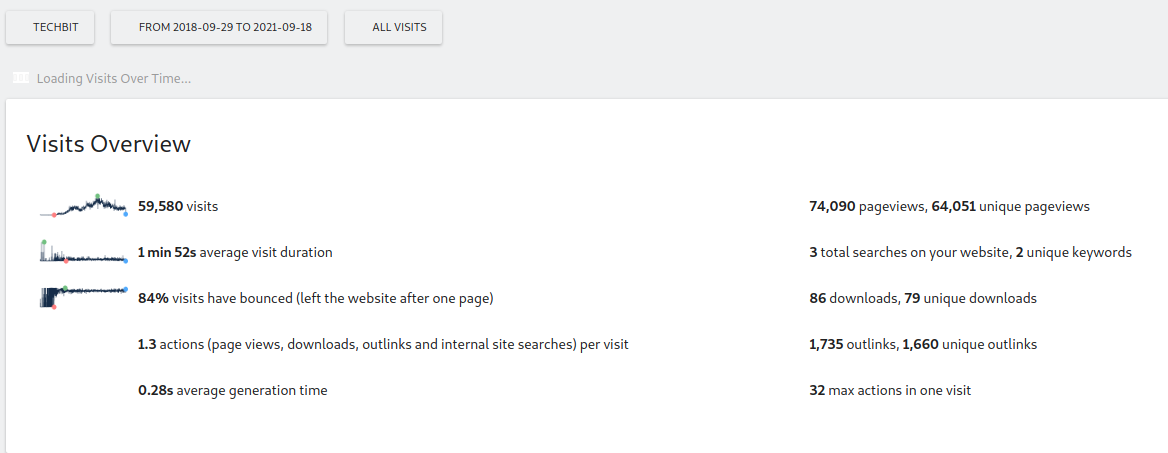
There’s a total of:
- 59,580 tracked visits
- 74,090 pageviews
- 64,051 unique pageviews
As mentioned, these numbers do not include visitors who are sending Do Not Track signals, using ad-blocking software, and it also doesn’t include bots, website crawlers, or automated exploit attempts.
To get an idea of the “real” number, we can take the number of unique IP addresses contained in the web servers access logs per day to get an average per day visitor count. Requests from bots, web crawlers, exploit attempts, etc. have all been removed before determining the number of unique IP addresses per day. Even so, this is still just an estimate.
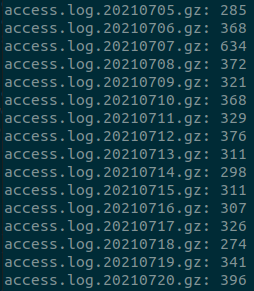
So it’s usually in the two to four hundred range per day. Averaging across all the logs from October 2, 2020 to September 17, 2021, we get an average of 352 unique IP Addresses per day.
We can make some assumptions and extrapolate that number out to account for the missing access logs from September 15, 2018 to October 1, 2020.
Assumptions:
- Traffic levels for the first 6 months following launch would be no where near the above average, so our “start date” for missing access logs that we’re going to use is March 15, 2019
- March 15, 2019 to October 1, 2020 is 567 days
567 days * 352 unique IP Addresses per day = 199,690 unique IP Addresses. The total number of unique IP Addresses from the access logs from October 2, 2020 to September 17, 2021 is 123,266. This means that 322,956 (199,690 + 123,266) is closer to the “true” number of unique visitors to my blog in three years versus the number of “tracked” visits (59,580).
Most Popular Articles
According to the tracked statistics, my most popular article by far is my tutorial on Creating a Bootable Windows 10 UEFI USB Drive Using Linux.
This article has 51,458 page views and 44,087 unique pageviews versus the next in line article Creating a Bootable Ubuntu UEFI USB Drive at 5,738 pageviews and 5,130 unique pageviews.
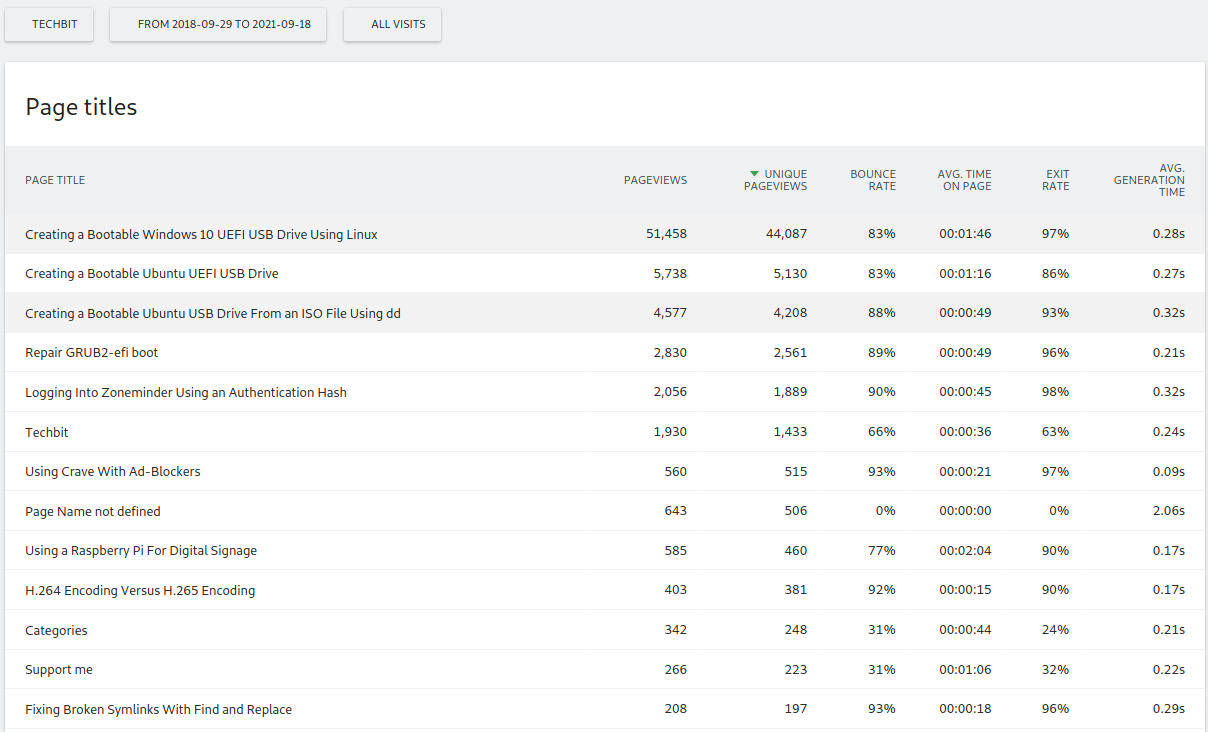
It seems I wrote a banger of an article that actually made my blog more popular than it otherwise would have been. I’ve seen links to this article posted in a number of different places by people who have found it worked great for them. So that’s really cool and what I was hoping for when I was deciding to create this site.
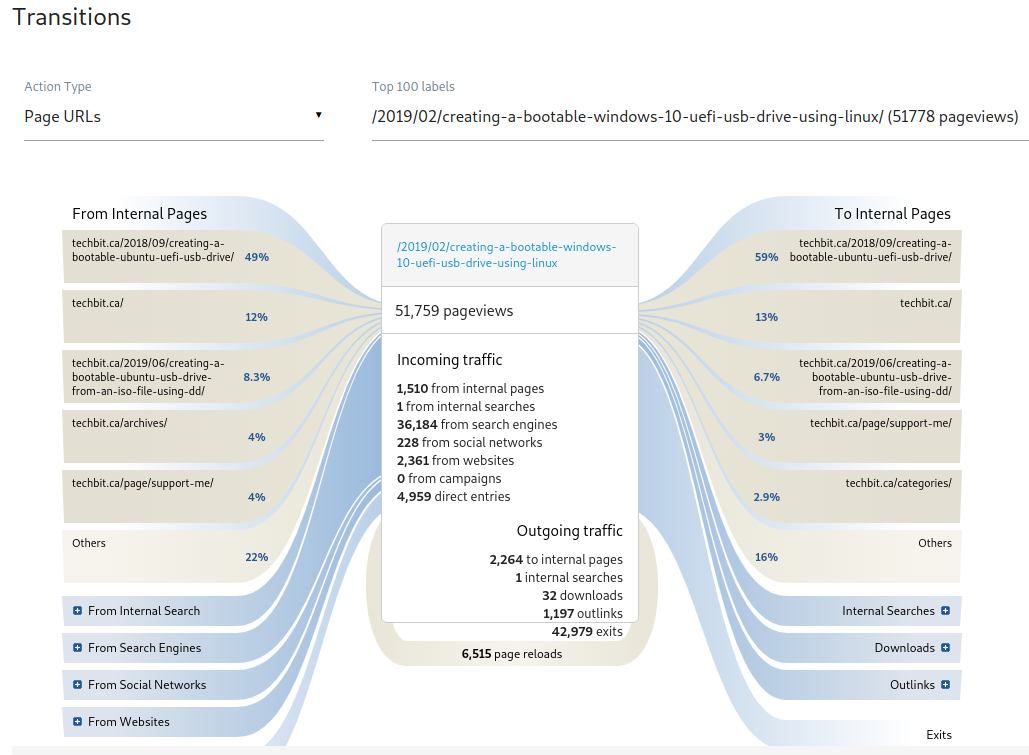
This graphic shows a breakdown of traffic in and out of this single page which is really neat.
I can truly say though, that had it not been for the popularity of this article since I posted it, I likely would not have continued to write for my blog (see “So What Happened” above). Seeing how much this article has helped people is the reason I decided to keep this blog going and to hopefully get back to writing more for it.
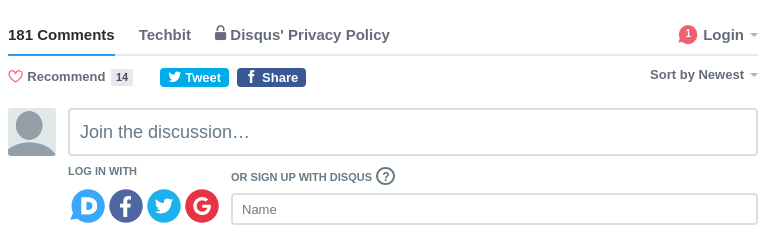
Most Comments
Since the article above is the most popular article by a large margin, it should come as no
surprise that this article also has the most active discussion; coming in at 181 comments.
These comments range from “thank you this was helpful”, to people running into problems and me
trying to help them.
Other Interesting Stats
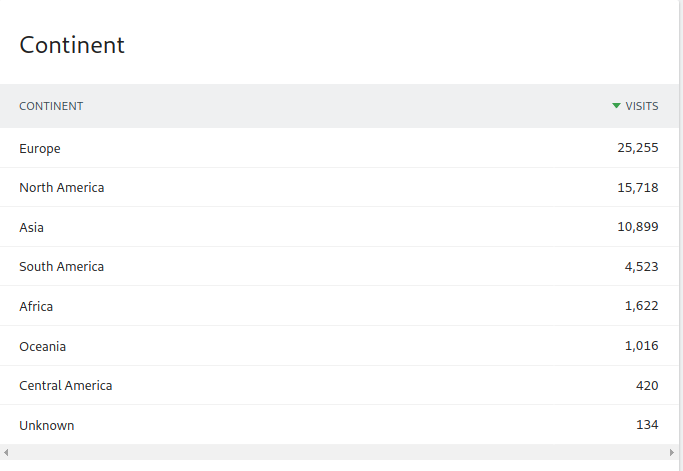
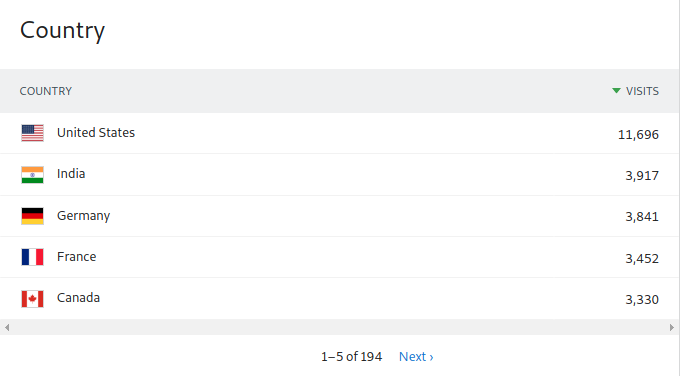
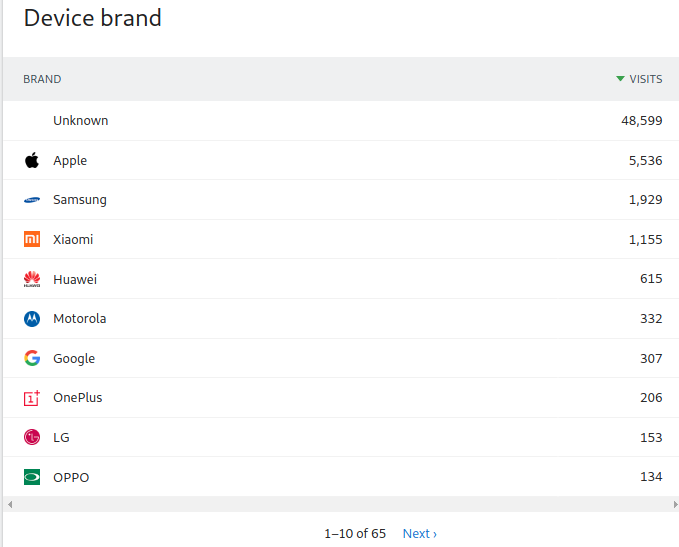
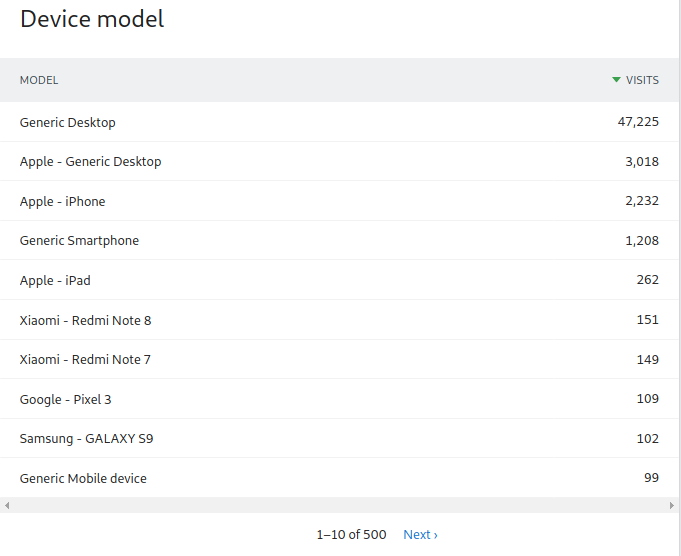
Locations
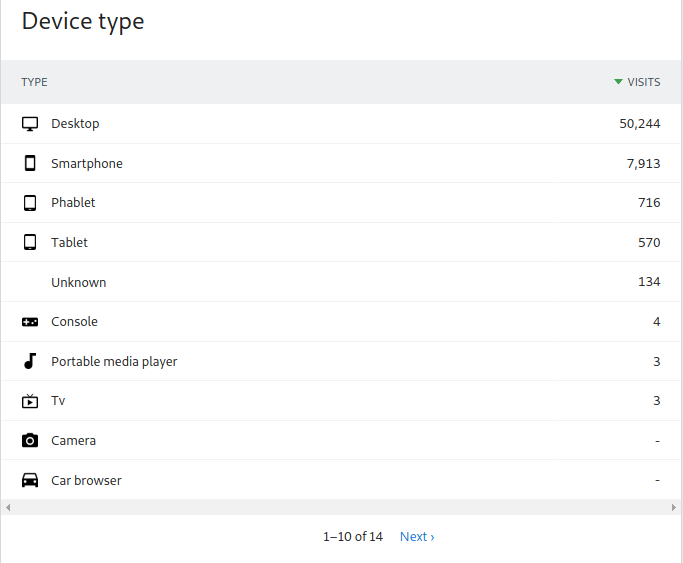
Devices
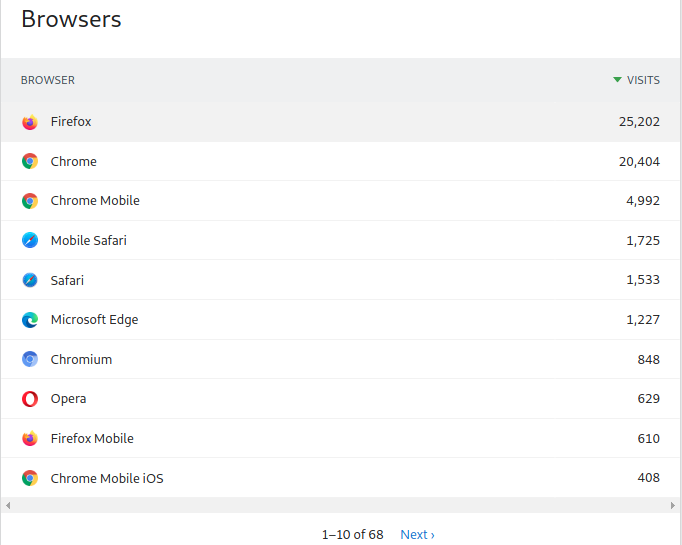
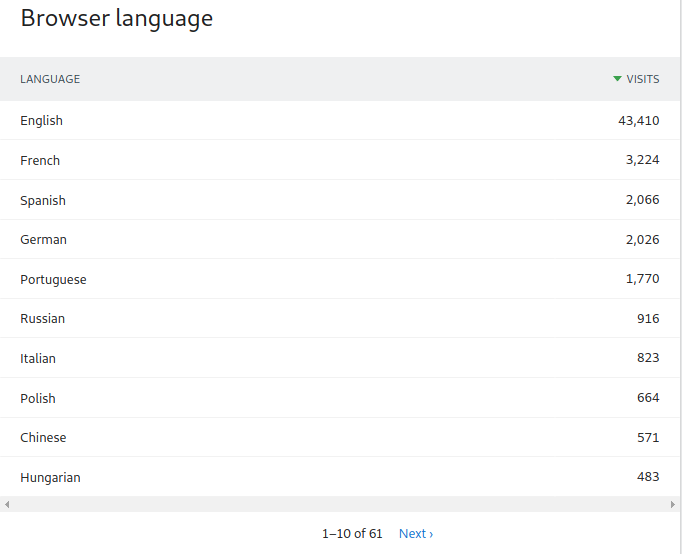
Web Browers
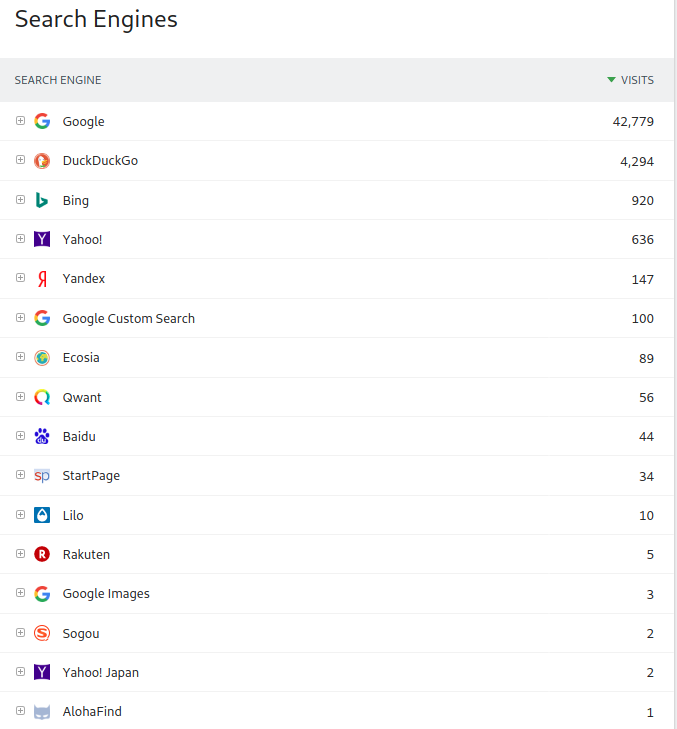
Traffic Sources
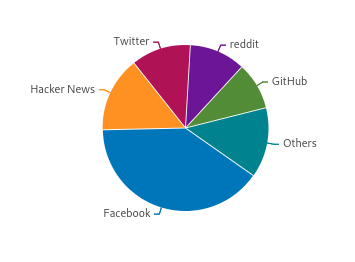
Social Networks
Money Money Money Money Mon-eh, MON-EH!! (Or Lack Thereof)
If you have a look at my Privacy Page, you’ll see that I do not, and will not, have advertising on this website. So… the only money I “make” (more on that in a minute) from this website is the result of donations to my Ko-Fi page. Even these donation requests I’ve made as unintrusive as possible, with a request at the bottom of every article, the Support Me page, or the floating Support Me button in the lower left hand corner of the site.
The Privacy Page does mention revenue from Affiliate programs (such as Amazon) as a possibility, however due to not writing much and not having the traffic required my request for Amazon Affiliate status was declined and I’ve never bothered to try it again yet. Maybe sometime again in the future.
Also, I just want to say a huge thank you to every single person who has donated to my Ko-Fi in the past!!! Your donations let me know that I really helped you out and that makes me feel all warm and fuzzy inside, so thank you!!!
Ok, so just how much money have I made from Ko-Fi donations since September 15, 2018?
Drumroll please!
Income
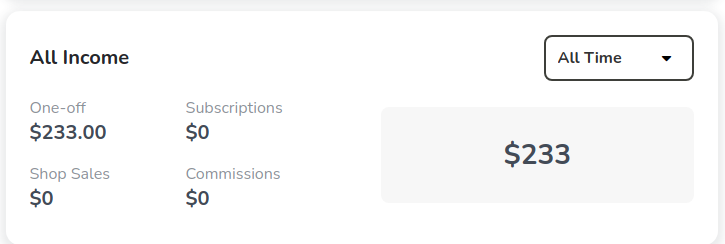
Yup… that’s it. $233 Canadian Dollars. So let’s break that down into some interesting money stats:
- Amount earned per tracked visitor: $0.003910708291373
- Amount earned per pageview : $0.003144823862869
- Amount earned per unique pageview: $0.003637726186945
- Amount earned per average day: $0.661577401716613
- Amount earned per estimated visitor: $0.001166803177631
Depending on the article/tutorial, it takes anywhere from 3-96 hours to “create” the article. What I mean by that is the amount of time to:
- Come up with the idea
- Research the idea
- Make sure everything works
- Set up a demo system and take screenshots of every part of the process
- Sort and arrange all the screenshots
- Write the content
- Revise and edit
- Follow the tutorial from scratch (that means setting up a demo/test system again) to make sure all my instructions work. Revise/Edit/take more screenshots as needed
- Upload and post
Also factor in any time used because of ADHD and perfectionism and yea… it’s a lot of work when you’re not working on it full time.
I have 22 articles/tutorials (including this one) posted, so that gives us the following:
- Minimum hours: 3 * 22 = 66 = $3.53030303 per hour
- Maximum hours: 96 * 22 = 2112 = $0.11032197 per hour
- Average hours: 49.5 (Average of 3 and 96) * 22 = 1089 = $0.213957759 per hour
None of that of course includes any time spent responding to comments, performing server upgrades/maintenance, etc.
This isn’t exactly a profit though, because it does cost money to host this site (Yes I could get away with a free hosting provider but I don’t want too).
Expenses
So what’s the cost breakdown on this blog?
It’s pretty simple, I have two servers from DigitalOcean at $5 (USD) each per month (so $10 USD total per month). One server is for this blog and my landing site/page Totalclaireity.com, and the other is for my metrics server, which I wouldn’t need except for this blog.
DigitalOcean bills per hour, so to do an estimate I broke the monthly cost down per day using “30.5” as the number of days. This isn’t totally accurate but it’s close enough for our purposes.
In USD
- Hosting costs per month: $10
- Hosting costs per day: $0.327868852459016
- Total number of days online: 1099
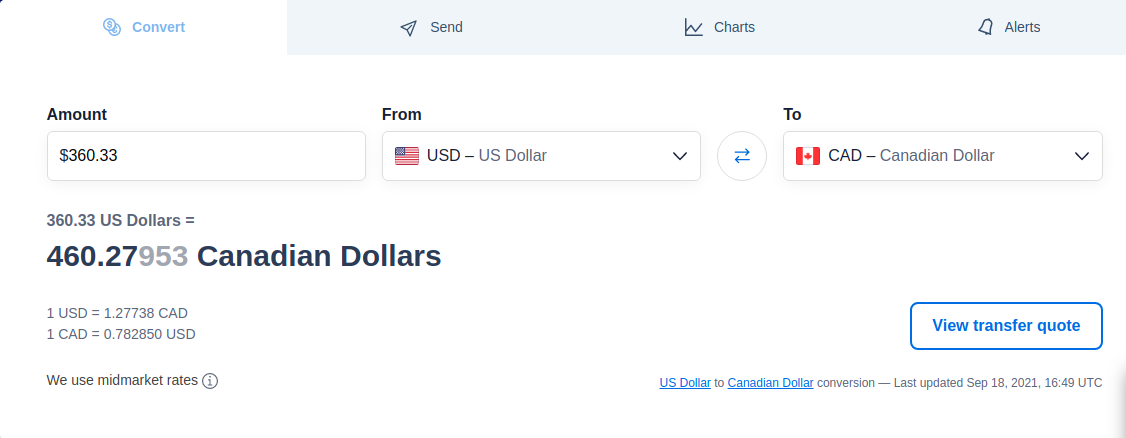
- Total hosting costs: $360.33
- Converted to CAD: $460.28 as shown below
“Profit”??
So I’m currently $227.28 ($233 - $460.28) in the negative on this blog after three years.
Yes I’m aware that I need to create and post more content, and I need to promote the blog more, and if I did those things I /might/ make a bit more money from it, but I thought it would be interesting to just have a look at where things stand after three years.
Remember kids, support your content creators if a) you want content to continue to be made and b) you want access to that content without having to endure intrusive advertisements, tracking, and having your personal information harvested and sold.
Thank you again so much to everyone who has donated and supported me, and I hope everyone (whether you’ve donated or not!) is able to find my content useful!!!
If you have any questions/comments please leave them below.
Thanks so much for reading ^‿^
Claire
If you enjoyed reading this article, please consider buying me a pizza slice!